

(Author: Jyotishmoi Phukan, senior GIS faculty from ACE GIS Technologies, India.)
Global warming, greenhouse effect, rise in the sea level, melting of glaciers, deforestation, dumping of waste, Presence of garbage islands, rivers drying out, frequent droughts are adversely impacting the environment and living species in the name of natural disasters and calamities. Now the question arising is how advancement of technologies, especially ‘Geographic Information Systems (GIS)’ will help mitigate the environmental problems.
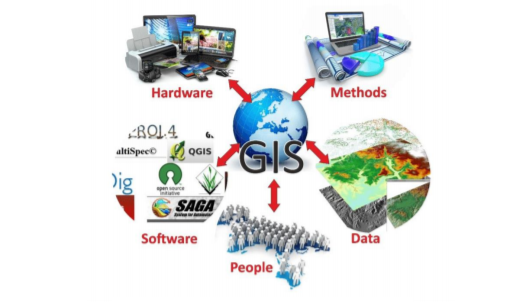
First of all we have to understand in short, what is the meaning of Geographic Information System (GIS). A research guide by the University of Wisconsin Madison defined GIS as “a geographic information system (GIS) is a system designed to capture, store, manipulate, analyze, manage, and present all types of geographical data. The key word to this technology is Geography – this means that some portion of the data is spatial”. In other words, data that is in some way referenced to locations on the earth is spatial. GIS is more than just a software. People and methods are combined with geospatial software and tools, to enable spatial analysis, manage large datasets, and display information in a map/graphical form.
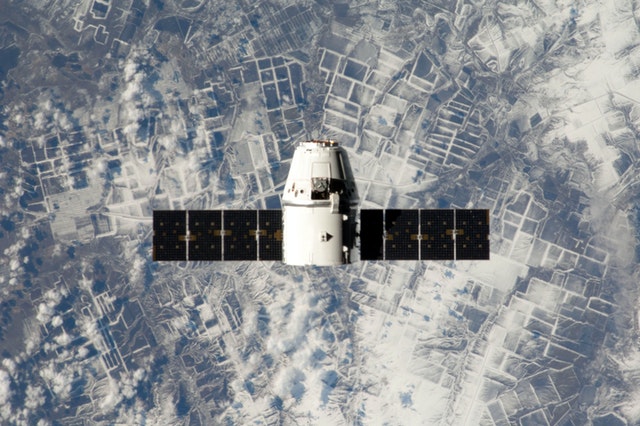
GIS can help in finding precautionary measures before the occurrence of natural hazards and even provide crucial data to find out the solutions after the hazard has occurred. During flood hazard, relocation of habitation can be done by demarcation of new or safer zones by creating Relocation maps. Intensity of water flow over the bank areas of the flooded river can be monitored by aerial images or satellite images.
A research titled IOT Based Water Level Monitoring System for Lake Water level explains that measuring devices can be installed near the banks with GPS location, where the rise of the water can be monitored remotely on a desktop. This data helps the disaster management department to take precautionary measures to tackle the flood hazard. Real time maps of the affected area helps in keeping a track on the situation and facilities like food, shelter can be planned for the flood victims.
Forest fires cause great loss to the habitat of the forest like loss of animal life, loss of vegetation cover, emission of methane and carbon dioxide gases from burning of tree woods. A report by the National Fire Protection Association titled Lightning fires and lightning strikes states that in the U.S forest fires are mostly caused by lightning strikes. And sometimes it is related to human activities such as the practice of Jhum cultivation, burning of garbage near forest areas can be related to forest fires caused by humans.
Immediate action plan required for proper analysis of the spread of the fire. So, in such a case, GIS helps a lot by creating thermal heat maps indicating the location of the forest fire. In this way, the rescue team can enter into the forest with a proper plan to control the fire from massive damages.
Everyone knows how hazardous the occurrence of earthquakes is! It causes great loss to human and animal lives. Earthquake hazards cannot be controlled but still early warning can be given to the public. Seismic devices can be installed in the earthquake prone areas with location indicators. These devices can record the intensity of the earthquake and early warnings can be given if any movement is detected. The readings can be collected remotely on a desktop and maps can be prepared. Through GIS technology regular map updates can be produced helping the disaster management department to carry out proper plans like preparedness and precautionary measures.
Indian agriculture is mostly dependent on the monsoons. Indian monsoons are unpredictable though as early onset of monsoon and sometimes there is a huge delay. This condition severely impacts crop cultivation and production. This uneven condition leads to the occurrence of drought in many areas. To tackle the drought condition, irrigation facilities are needed in the affected areas. This whole scenario can be mapped out using GIS like thematic maps can be created by showing the drought affected areas.
Thus, the irrigation facility layout can be planned over the affected areas like construction of canal routes, installation of tube wells or bore-wells. If there are any areas which already have existing irrigation facilities and still drought has occurred then those areas can be monitored for repair and maintenance. Thematic maps like crop production maps can be produced for comparing the trend of production in each year and even during drought conditions.
The emissions of the greenhouse gases are also responsible for global warming.
The Atmosphere: Getting a Handle on Carbon Dioxide, a report by NASA clearly shows that throughout the years it is noticed that the carbon dioxide content in the atmosphere has increased which is the prime cause of rise in the temperature of the atmosphere. Carbon dioxide gas has the property of absorbing heat and smoke from the factories, industries, and burning of garbage are largely responsible for the emission of carbon dioxide.
Throughout the years, uneven rise of temperature or even fall in temperature have been observed across the globe. The areas where in winter experience snowfall and summer temperatures rises up to 27o C max are now experiencing sudden rise in temperature up to 55o C during summers. Some areas are experiencing sudden drops in temperatures too to an extreme level. There is dis-balance in temperature conditions across the globe. Rise in temperature of the atmosphere is also responsible for the melting of the glaciers. Glaciers of the mountains are melting in a rapid manner nowadays.
An official magazine of the oceanography society titled Oceanography warns that the glaciers of Antarctica and the Arctic are also melting leading to the rise of sea level. These all things can be mapped out using GIS technology like heat maps can be generated, through which we can keep an update on the temperature conditions in any area across the globe. Through satellite images, the coastline areas can be monitored to check rise in the sea level. Imageries of different years can be compared to detect the changes in the coastline.
People are mostly fond of wooden craft materials like any decorative item, furniture, utensils, ornaments, etc. These luxuries of the people come at the cost of cutting down trees. Deforestation is one of the greatest threats to the natural environment. Increases in human activities such as construction of buildings, factories, industries have led to large scale deforestation over the years reports in a research titled Assessment of Drivers of Deforestation and Forest Degradation in Phnom Tbeng Forest Based on Socio-Economic Surveys.
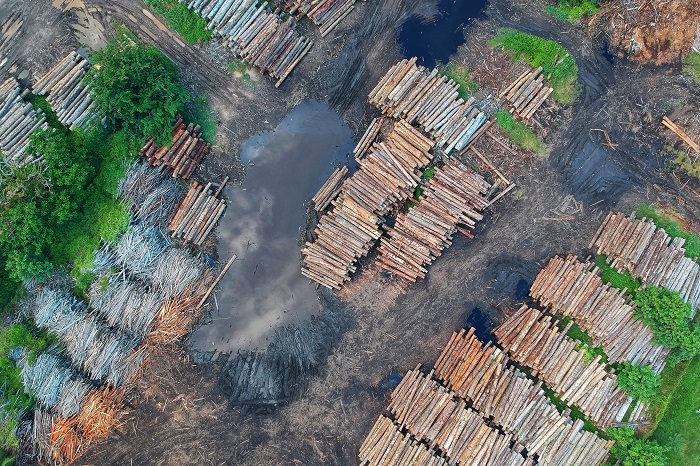
Due to deforestation, many animal species have become endangered and some are extinct as well. The presence of green canopy is helpful in tackling the problem of carbon emission as we know that trees consume carbon dioxide and in return deliver fresh oxygen. So, it is advised that forest resources should be used in a balanced manner. It takes a minute to cut down a tree, but it takes years for a tree to grow.
Protective measures like afforestation (which means planting of new trees), relocation of trees by lifting the trees from root and placing it in a new area should be done if any area is going to be cleared out for construction purposes. The practice of Jhum cultivation (which means slash & burn agriculture) should also be stopped which causes loss to forest areas. Here, GIS can help in the process of monitoring the conditions of both deforestation and afforestation activities. Through satellite data we can compare images of different time intervals to see the changes that have occurred in a forest area. New plantation areas can also be mapped out through satellite images.
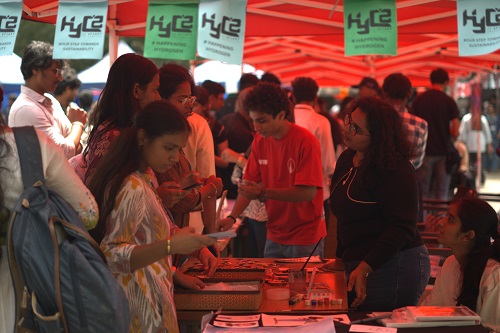
The Geographic Information System (GIS) is very helpful for tackling the problems of the environment. This technology is spreading its wings and supporting various departments. In my opinion every private or government department should incorporate GIS technology. There should be awareness programme to spread the knowledge & utility of GIS technology. People should come out to learn the new skills of GIS technology while with the help of technology and positive approach.
ACE GIS is using a geographic information system(GIS) technology for green recovery, so what is your tool? Share your green story with us!
Media courtesy: ACE GIS technologies, Twitter, pexels
Featured photo: spaceX


Your style is really unique compared to other folks I have read stuff from. I appreciate you for posting when you’ve got the opportunity, Guess I will just bookmark this web site.